Global Noise Plot
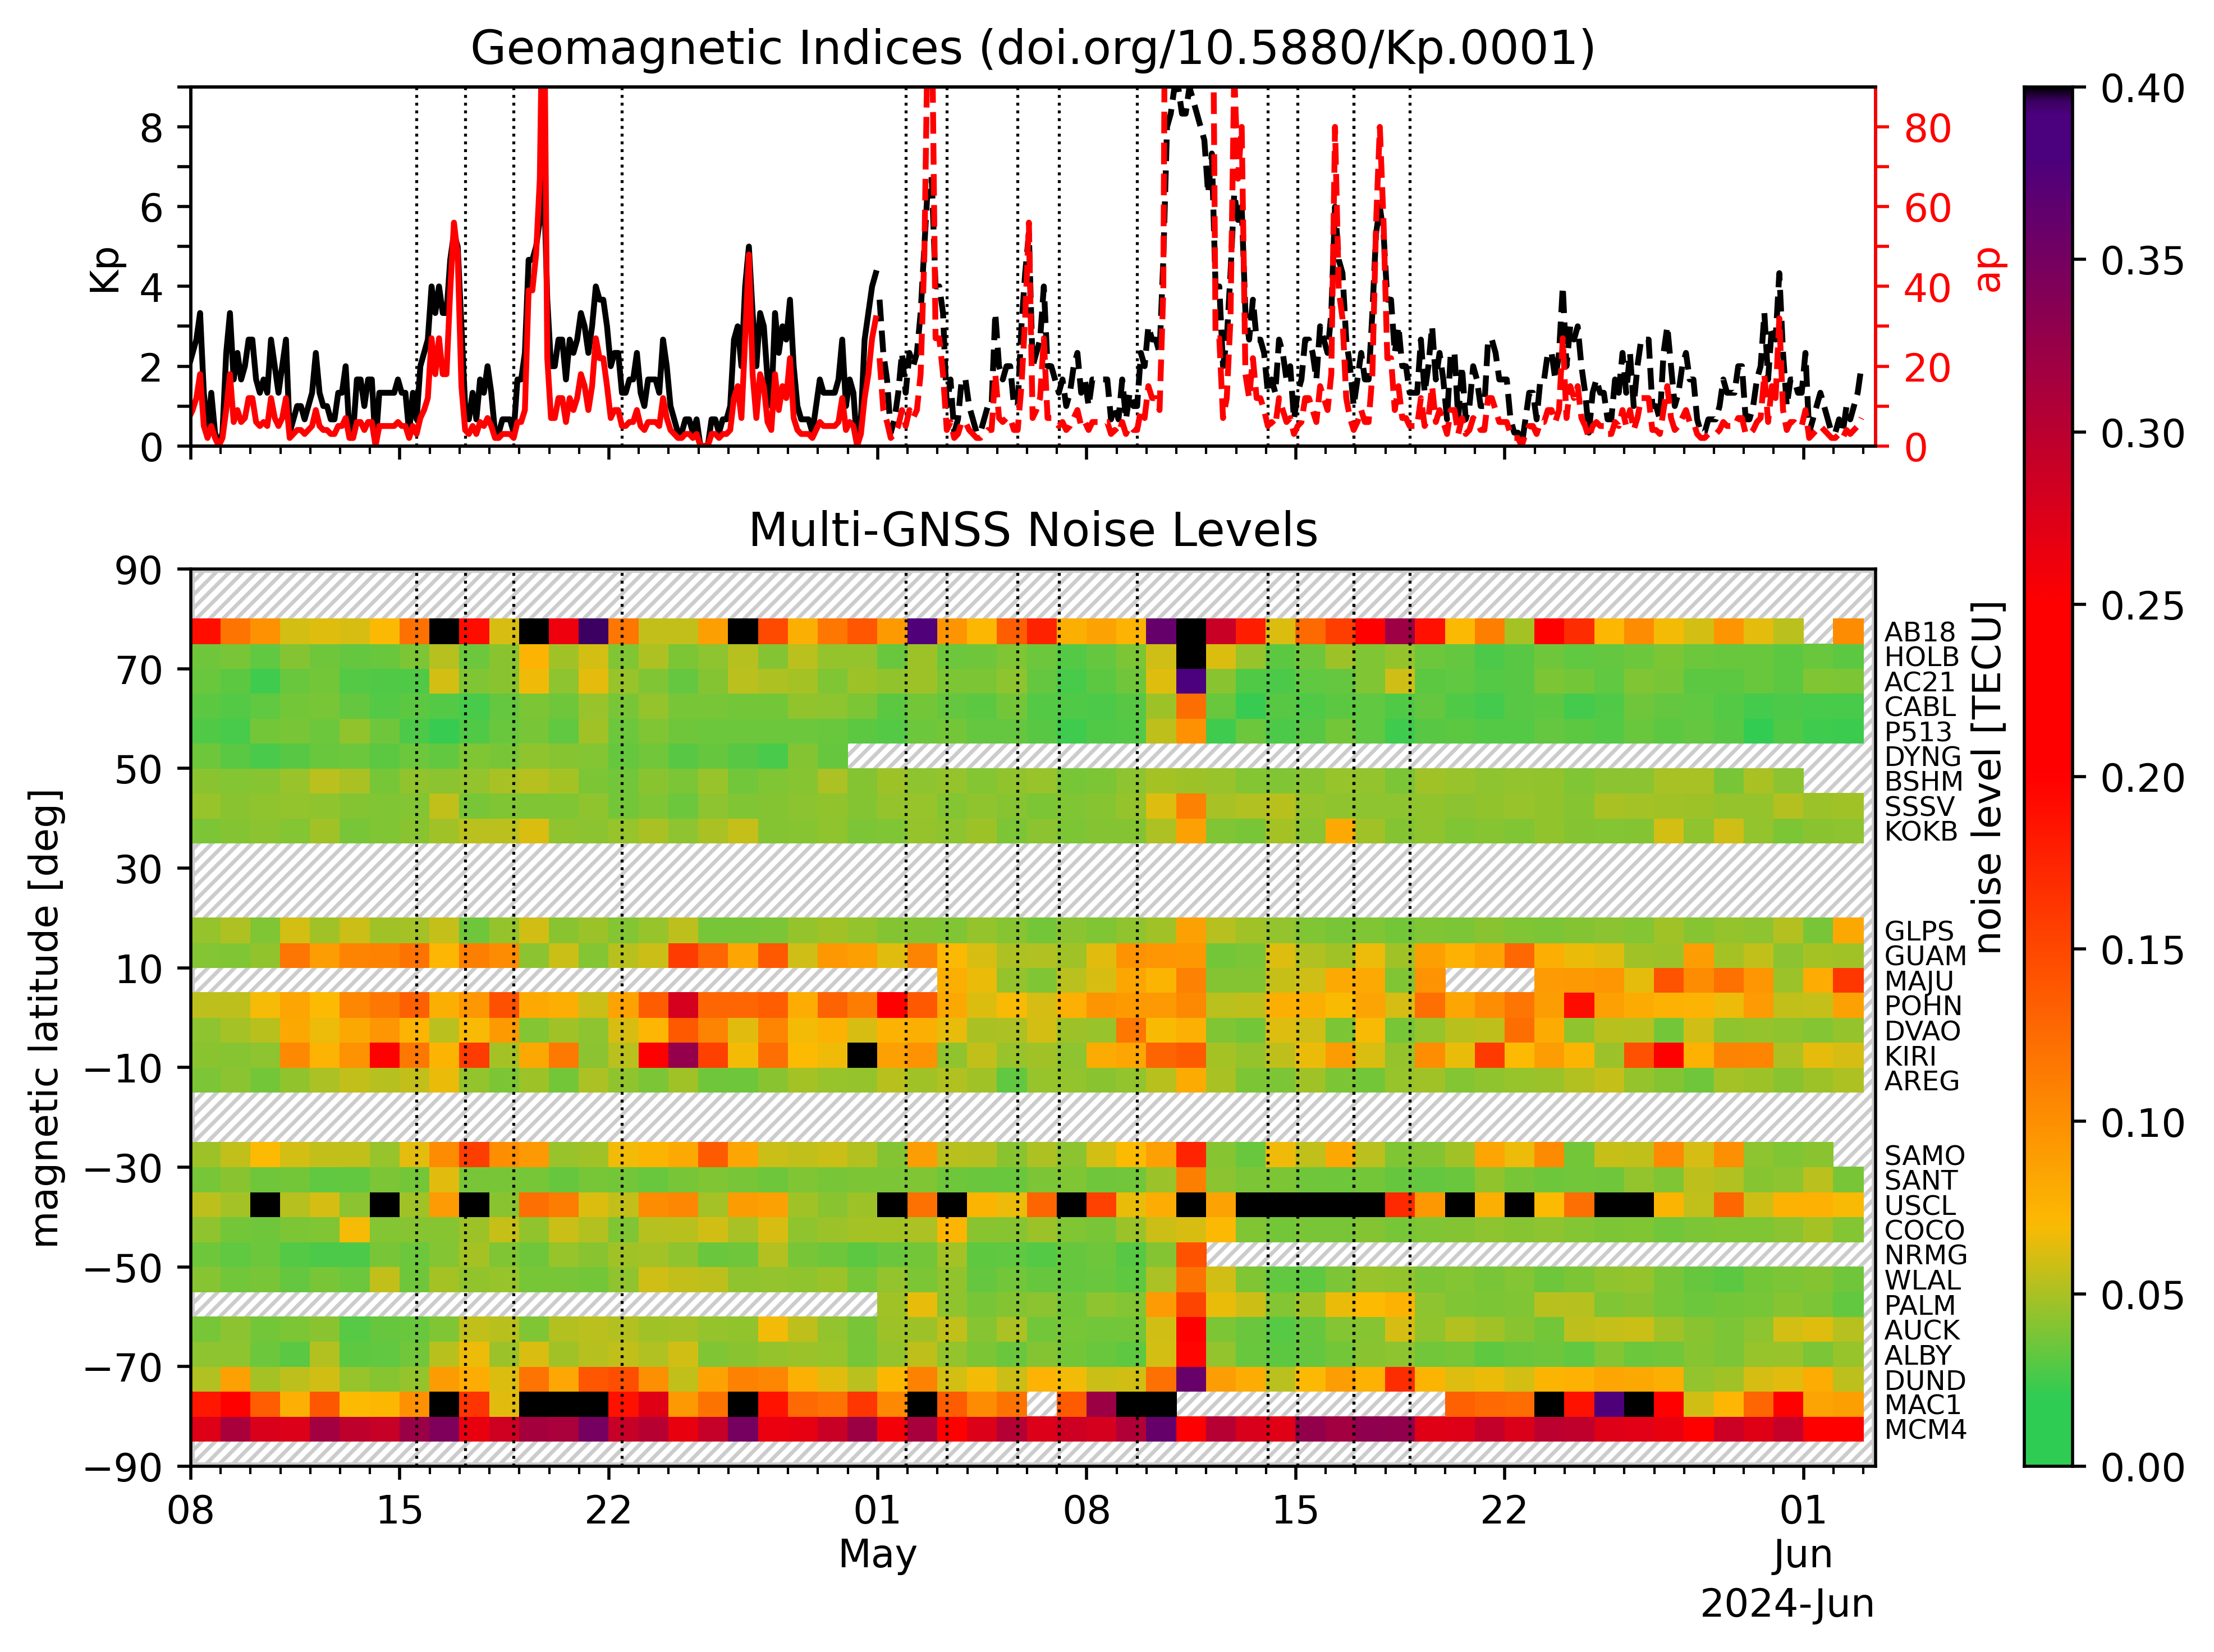
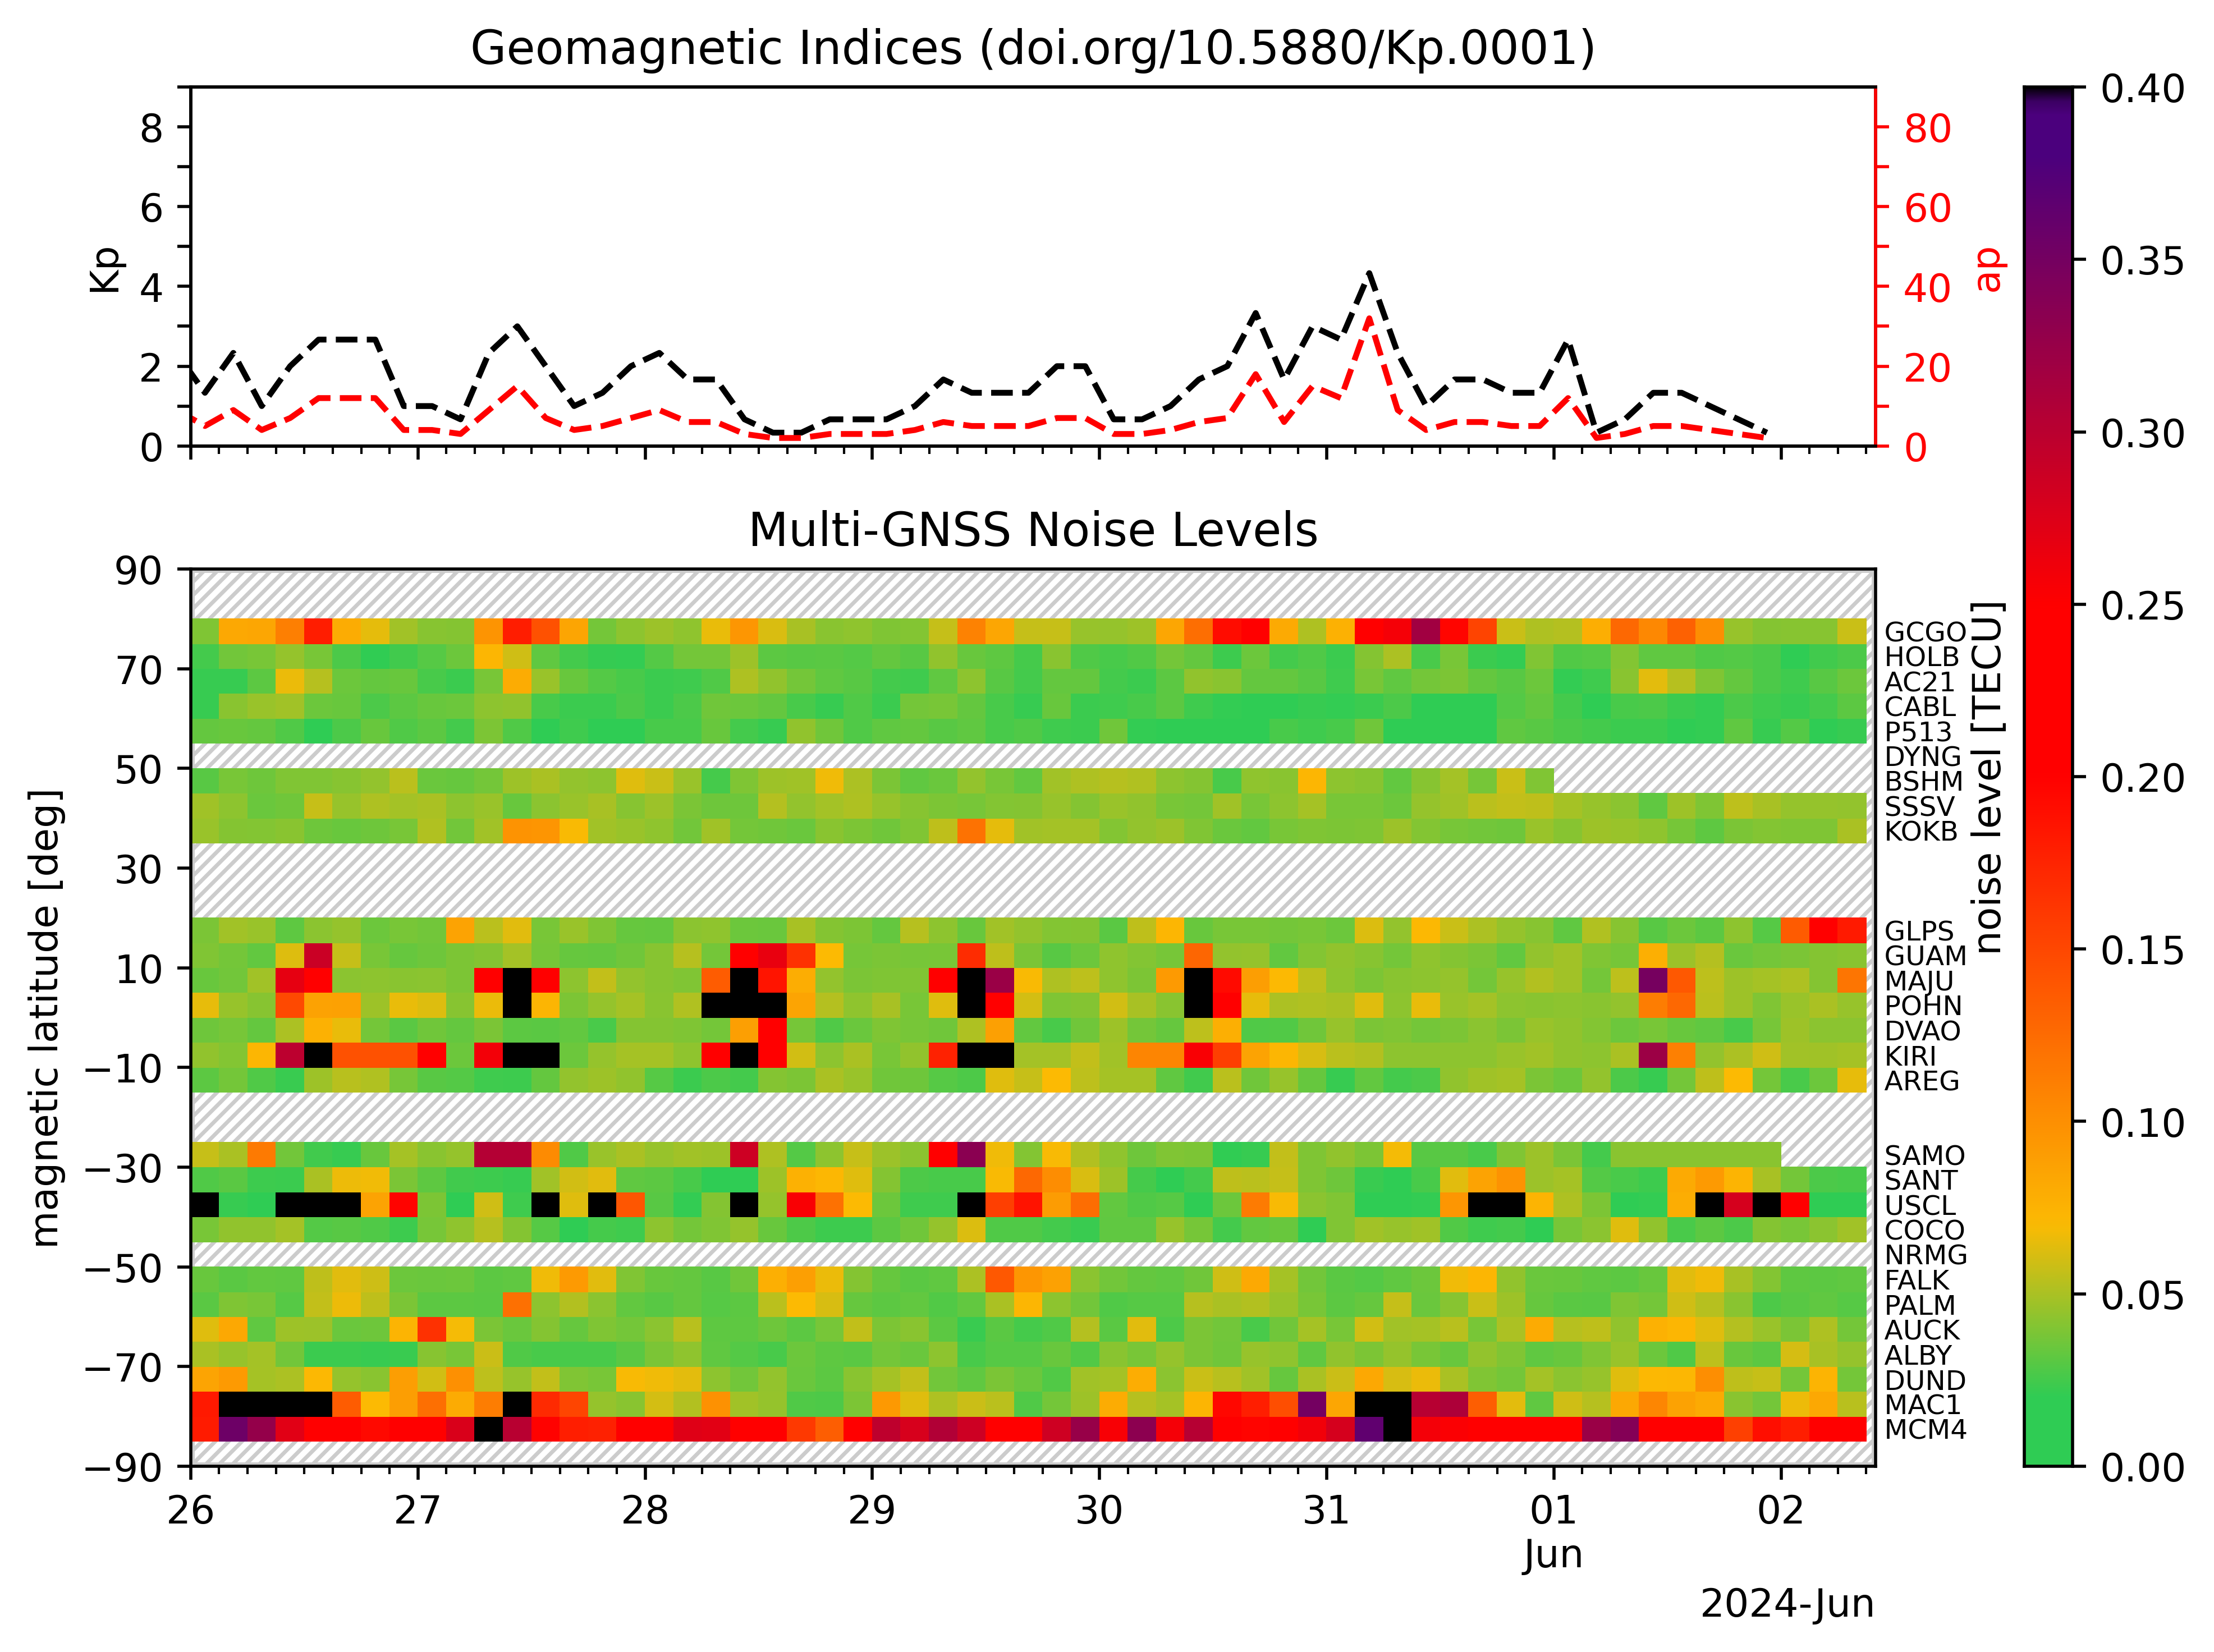
This page displays the current ionospheric activity level, and relates it to current space weather conditions. Each plot shows a different time frame: 8 weeks of daily values for the first one, and 1 week of 3-hourly values for the second one. The bottom panels show the ionospheric activity level (estimate derived from magnetic-latitude-dependent noise statistics of GUARDIAN time series across different constellations) across all magnetic latitudes. The top panels show the planetary Kp index (an indicator of geomagnetic activity and space weather conditions, see doi.org/10.5880/Kp.0001) in black and an estimate derived from the GUARDIAN time series in blue.


